
Synopsis
This is the first post of a two part series, taking a closer look at the offshore drilling sector. In the following, I will compare the sub-sectors of offshore drilling in order to establish which of these it will pay most having exposure to in the current upswing. The second post will look at fleets, contract books, financials and valuations for the individual offshore drillers to identify what company will be the fastest horse in this race.
Introduction
Oil services (as represented by the OIH ETF in Fig 1 below) have had a strong start to the year (+ ~57%), outperforming the overall energy complex (XLE ETF) by ~14% and oil and gas producers (XOP ETF) by ~12%, respectively, on a year to date basis.
Fig 1: OIH vs XLE & XOP year to date performance

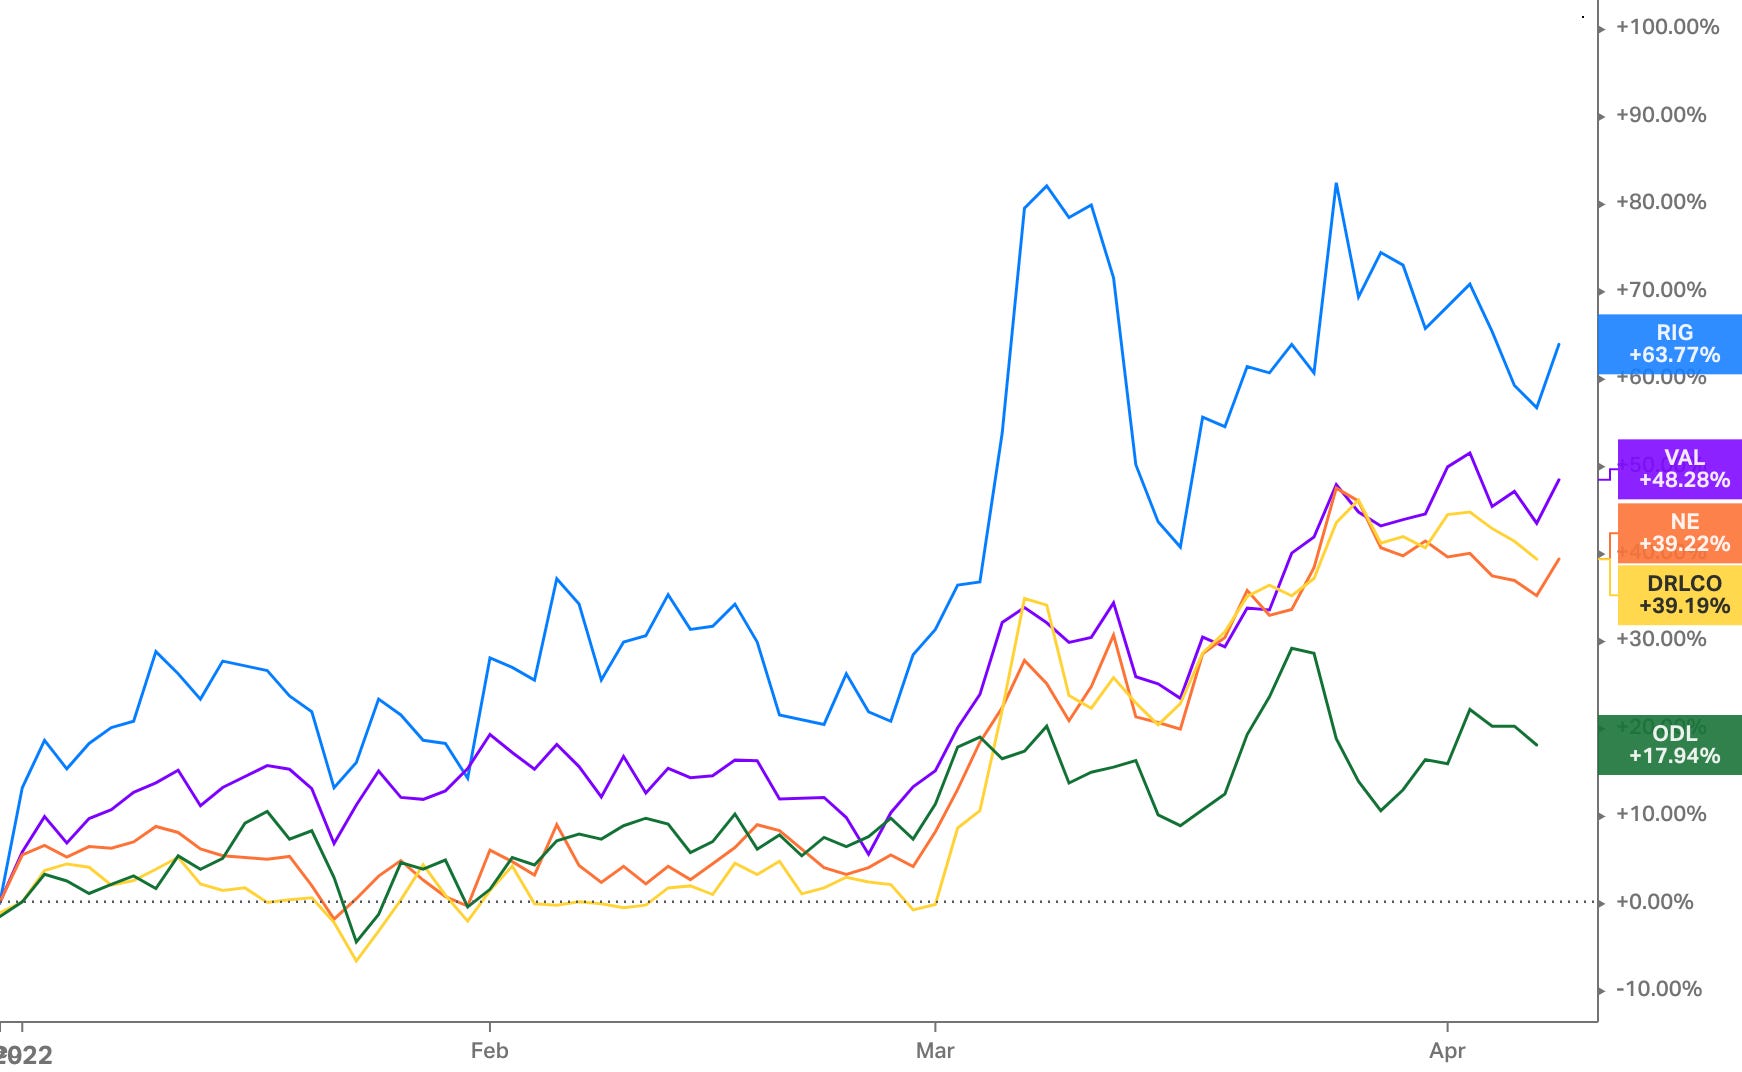
This also applies to offshore drillers. The group has seen meaningful share price appreciation year to date (see Fig 2), with Transocean (RIG) outperforming peers ~15% so far.
Fig 2: Offshore drillers share price performance year to date
With the sector now appearing to have reached a bullish inflection point (in addition to a palpable narrative change towards more oil production in OECD nations), I thought it timely to examine what company in this space will offer greatest torque to this cyclical upswing. I begin by looking at the sub-sectors of offshore drilling (jackups, semi-submersibles, drillships) to establish which of those I want greatest exposure to.
Sub-Sector Comparison
Offshore drilling fleets can be broken down into jackups, semisubmersibles and drillships. In deciding what company to choose, it is useful to look at the market dynamics of the respective sub-sectors. This allows for identifying which of those appears most attractive and pick whichever company has the biggest footprint in that segment.
Fixtures & day-rates
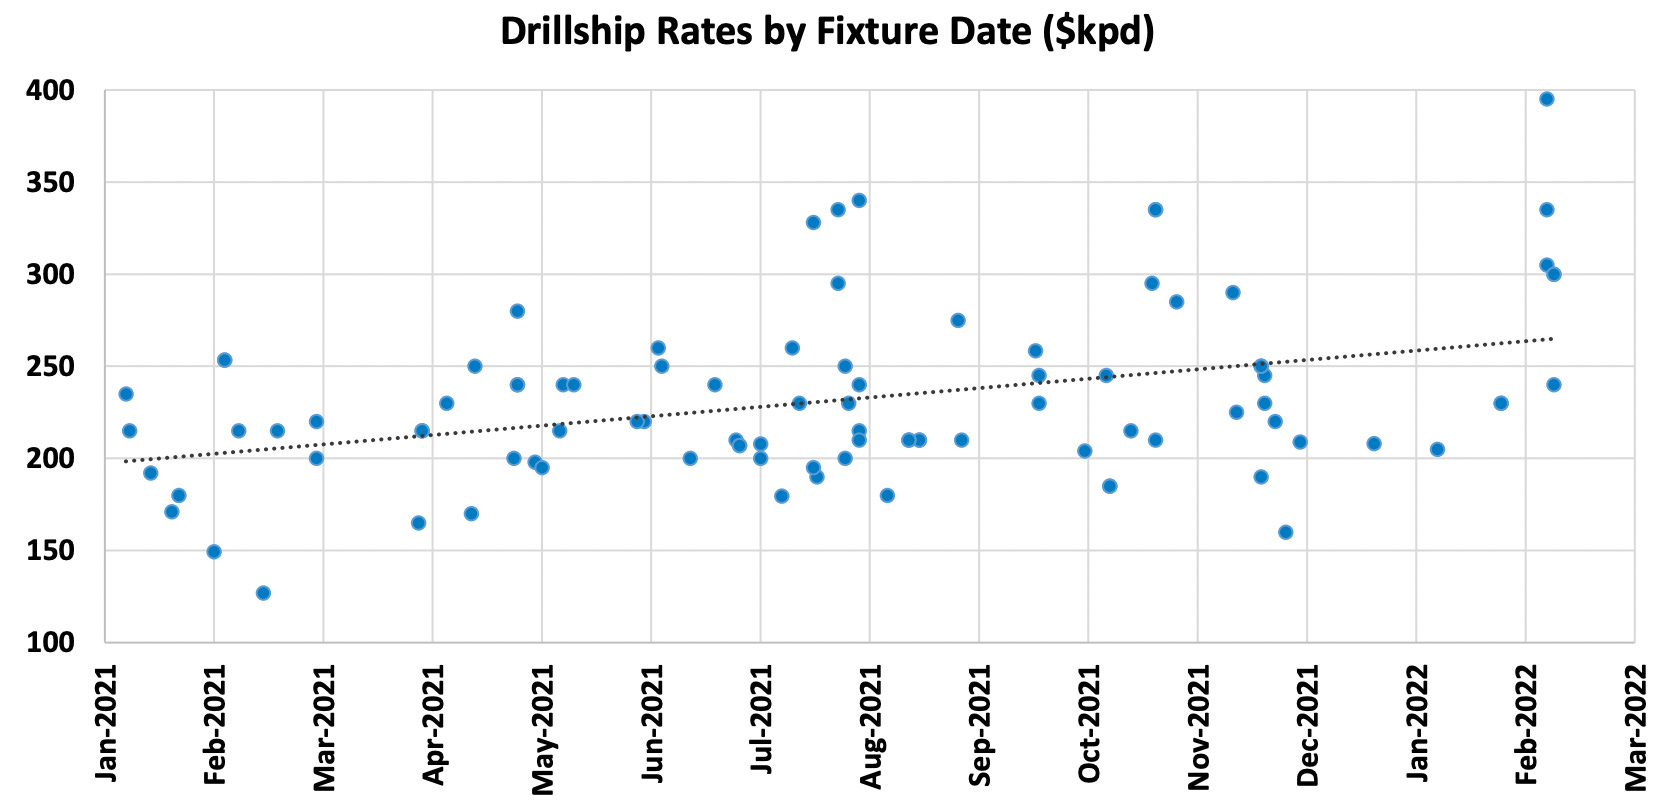
When looking at market trends in over the last twelve months (LTM), it appears that perhaps with the exception of drillships, day-rates have yet to inflect meaningfully higher (see Fig 3-6).
Fig 3: Jackups (benign) LTM fixtures
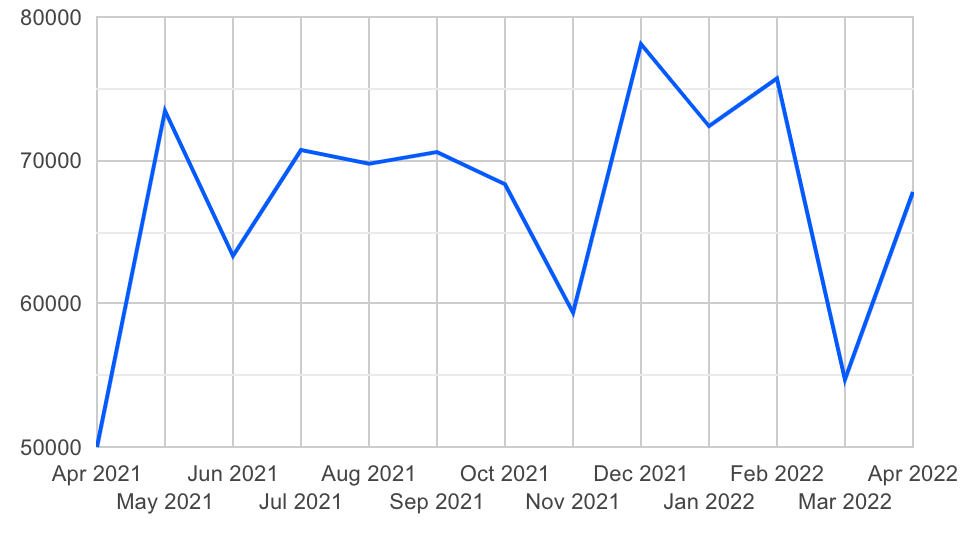
Fig 4: Jackups (harsh) LTM fixtures
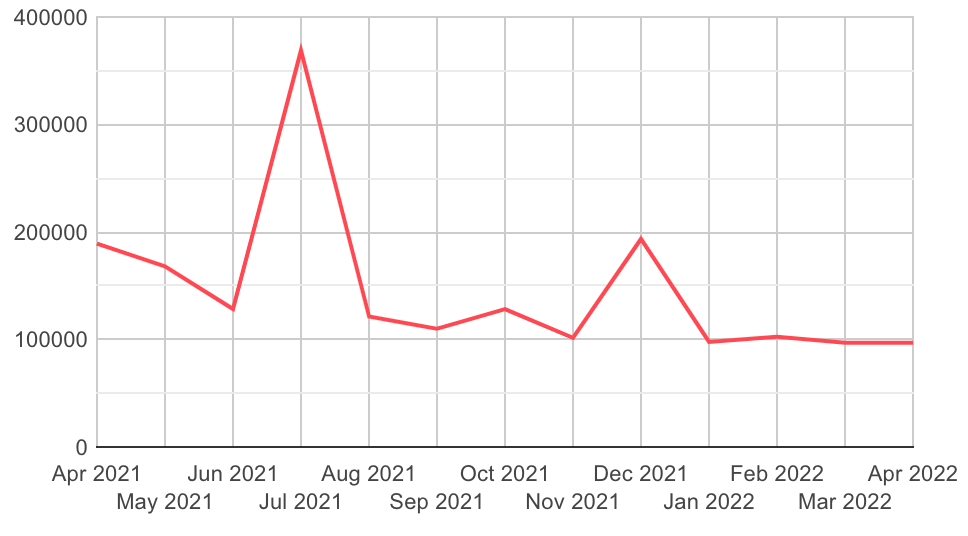
Fig 5: Drillships, semisubmersibles LTM fixtures*

Fig 6: Drillship fixtures since Jan 2021
Fleet utilisation & order book
Currently, utilisation is highest for drillships at 84-91%, followed by jackups at 65-75%, with semisubmersibles lagging at only 52-55% utilisation (see Fig 7-8).
Fig 7: Fleet utilisation by rig type

Fig 8: Fleet utilisation by rig type

When it comes to order book as a percentage of existing fleet, drillships come in at ~13%, jackups at ~7.5%, and semisubmersibles at ~6.5%, perhaps reflecting the order of utilisations (meaning higher utilisation results in greater order book).
Cyclicality and profitability
Jackups are often described as a more stable, less cyclical market compared to drillships. Looking at peak to trough moves for day-rates over the past 15 years, this appears to be confirmed. While day-rates for (ultra deepwater) rigs oscillated between ~600k and ~130k (~78% decline), those for jackups fell from a high of ~220k to a low of ~90k (~60% decline) from between 2014 and 2016-18 (see Fig 9-10). Unfortunately, I could not find similar data for semisubmersibles.
Fig 9: Ultra deepwater day-rates & utilisation

Fig 10: Jackups day-rates & utilisation

Gathering data from past annual reports of the major offshore drillers, I performed a similar exercise going back to 2012. Per my sample, peak to trough decline in day-rates for floaters (both semisubmersibles and drillships) were about 10ppt more pronounced than for jackups (see Fig 11), again confirming the idea of greater cyclicality in drillships. Within drillships, ultra-deepwater appears most cyclical. Unfortunately, most companies stopped breaking down into the categories of midwater, deepwater, and ultra-deepwater post 2017.
Fig 11: Average day-rates by rig type

More cyclical day-rates should translate into greater variability in margins all else equal. Using the same sample of companies as per above in Fig 11, I compared average EBITDA margins per rig type during the period (see Fig 12). Floater margins peaked at about ~55% vs jackup margins at ~45% before they both fell to similar levels in the high teens.
Fig 12: EBITDA margin by rig type

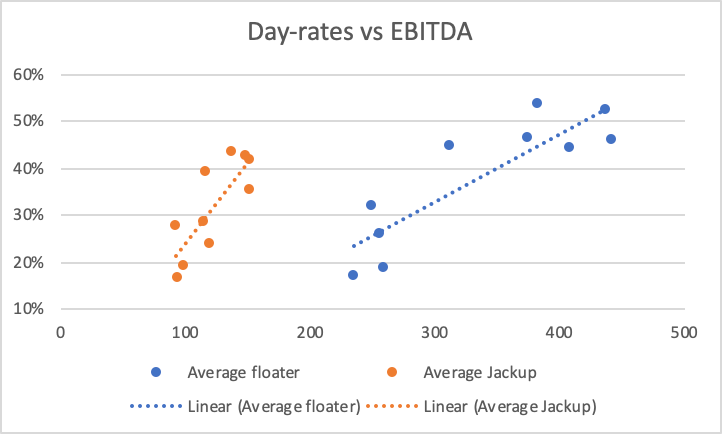
This allows for the conclusion that in a cyclical upswing, as I believe the sector is experiencing right now, day-rates for drillships (esp. ultra-deepwater) will reset over-proportionally higher compared to day-rates for jackups. Further, day-rates and EBITDA margins appear correlated (see Fig 13), ie higher day-rates going hand in hand with higher margins. Hence, I would look to have more exposure to drillships (esp. high-spec and ultra-deepwater) rather than jackups.
Fig 13: Day-rates vs EBITDA correlation
Note: freely available data is scarce and does not always reference rig specification (high-spec vs low-spec) or classification (benign vs harsh environment) so have to be taken with a grain of salt. Given my attempt at triangulating with data from alternative sources and reaching similar conclusions I consider them a useful indication nonetheless.
Conclusion
This post looked at day-rates, utilisation, fleet order book, cyclicality of day-rates and operating margins for the respective sub-sectors of offshore drilling. Given that day-rates appear to have inflected already for drillships, and factoring in the strong cyclicality of drillship day-rates and hence margins vs jackups, favouring players with greater exposure to the former seems sensible. In the next post of this offshore deepdive, I will analyse fleets, contract books and financials for the drillers.
Thank you for reading,
LazCap
NOT FINANCIAL ADVICE
The information contained on this Website and the resources available for download through this website is not intended as, and shall not be understood or construed as, financial advice.